

Mastering Fundamental Chart Patterns for Trading Success
Exploring Support and Resistance Levels for Better Trading Decisions

Support and resistance levels are essential concepts for traders, serving as psychological barriers where price reversals frequently take place. By analyzing historical price data, traders can pinpoint these levels, which may differ across various timeframes and market conditions. Identifying these key levels empowers traders to make knowledgeable choices regarding potential entry and exit strategies.
Support is the price point where buying interest is robust enough to surpass selling pressure, preventing price declines. In contrast, resistance emerges when selling interest outstrips buying pressure, causing the price to stagnate or reverse. Grasping these dynamics is crucial for forecasting price movements in diverse markets, including stocks, forex, and cryptocurrencies.
Key Continuation Patterns Every Trader Should Know
Continuation patterns are vital for traders aiming to capitalize on existing trends. These formations suggest that the current price trend is likely to persist following a brief consolidation period. Common patterns such as flags, pennants, and triangles are closely monitored by traders for potential trading signals.
By studying these patterns, traders can make informed predictions regarding future price movements. For example, a flag pattern typically follows a significant price movement and indicates that the trend will continue in the same direction once the price breaks out of the flag formation. Familiarity with these patterns equips traders with tools to enhance their trading strategies effectively.
Decoding Candlestick Patterns for Market Insights
Candlestick charts offer a powerful means of visualizing market sentiment and price movements. Each candlestick corresponds to a specific time frame, displaying the open, close, high, and low prices. Analyzing the shape and color of these candlesticks provides traders with valuable insights into market psychology.
For instance, a long green candlestick signifies strong buying interest, while a long red candlestick indicates selling pressure. Recognizing candlestick formations, such as doji or hammer formations, can deliver early signals for potential momentum shifts, enabling traders to adjust their strategies accordingly.
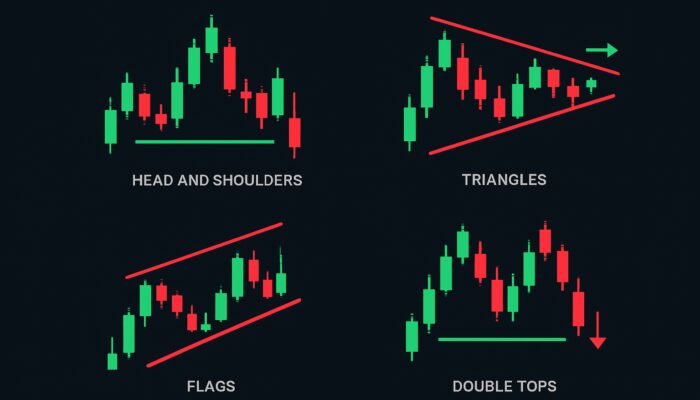
In-Depth Analysis of Chart Patterns Cheat Sheet
Expert Insights on Triangle Patterns and Their Implications
Triangle patterns, including ascending, descending, and symmetrical triangles, are crucial formations traders use to spot potential breakouts. An ascending triangle typically develops in a bullish market, characterized by higher lows and a flat resistance level. This pattern indicates that buyers are gaining strength, and a breakout above the resistance may lead to substantial upward movement.
Conversely, a descending triangle often emerges in bearish markets, characterized by lower highs and a flat support level. This setup suggests increasing selling pressure, with a breakout below the support potentially signaling further declines. Notable examples include patterns observed in stocks like Tesla, where traders have effectively predicted price shifts based on triangle formations.
Understanding the Head and Shoulders Pattern for Trend Reversal
The head and shoulders pattern is a well-known reversal formation indicating a potential trend change. This pattern comprises three peaks: a higher peak (the head) flanked by two lower peaks (the shoulders). Traders seek this formation at market tops, signaling the exhaustion of buying pressure.
To accurately identify entry points, traders examine the neckline, which connects the lows of the formation. A break below the neckline validates the reversal, prompting traders to consider short positions. Grasping the intricacies of this pattern allows traders to effectively capitalize on market cycles and manage their risk.
Analyzing Flags and Pennants for Quick Trading Opportunities
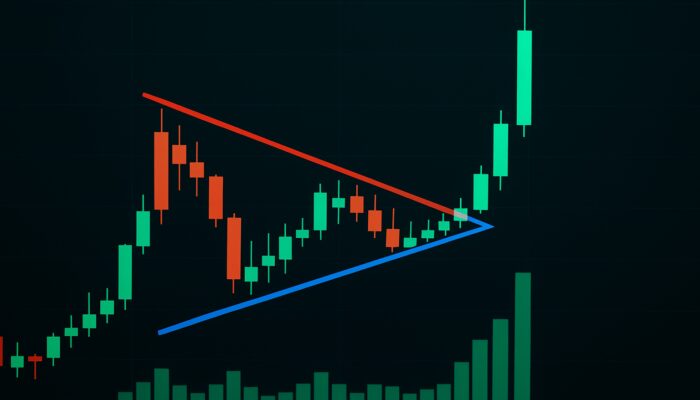
Flags and pennants are short-term continuation patterns that present swift trading opportunities. A flag pattern takes on a rectangular shape that slopes against the prevailing trend, while a pennant features converging trendlines. Both patterns indicate a brief consolidation before the trend resumes.
Volume plays a pivotal role in confirming breakouts from these formations. A breakout accompanied by heightened volume suggests a strong continuation of the trend, whereas low volume may indicate a false breakout. Traders can leverage these patterns for timely entries, enhancing their overall trading strategy.
Identifying the Most Trustworthy Reversal Patterns
Understanding Double Tops and Bottoms for Trend Reversal Signals
Double tops and bottoms are classic reversal patterns that signal potential trend changes. A double top occurs after an uptrend, featuring two peaks at similar price levels, indicating a depletion of buying pressure. Conversely, a double bottom forms after a downtrend, displaying two troughs that signal a buildup of buying interest.
These formations are often validated through volume analysis to confirm their reliability. Traders typically establish price targets based on the height of the pattern, providing a clear strategy for entering and exiting trades. Recognizing these patterns can significantly enhance a trader’s capability to spot market reversals.
What Factors Contribute to the Reliability of Chart Patterns?
The reliability of chart patterns depends on several critical factors. Volume confirmation is vital; patterns accompanied by high volume tend to be more credible. aligning the timeframe with broader market trends increases the chances of success. Patterns emerging during significant market events or news can also provide context that enhances their reliability.
Understanding market context is essential for assessing the success rates of patterns across various asset classes. Recognizing how external factors influence price movements enables traders to make informed decisions, ultimately improving their trading results.
Characteristics of Rounding Bottom Patterns
A rounding bottom is a gradual reversal pattern indicating a transition from a downtrend to an uptrend. This pattern features a smooth, curving shape, reflecting a slow accumulation phase as buying interest builds over time. Traders look for increasing volume during this formation, signaling growing participation and conviction among buyers.
Once the price surpasses the resistance level formed by the pattern, it often leads to significant upward momentum. Understanding rounding bottoms allows traders to identify potential long positions and successfully capitalize on emerging trends.
Examining Head and Shoulders Formations for Market Analysis
The head and shoulders formation, a classic reversal pattern, features a central peak (the head) flanked by two lower peaks (the shoulders). This pattern signals a potential trend reversal when the price breaches the neckline, connecting the lows of the two shoulders. Traders often utilize this formation to identify exhaustion in buying pressure, indicating a shift towards selling.
Price targets derived from the height of the pattern can guide traders in setting profit objectives. Understanding the intricacies of head and shoulders formations enhances a trader’s ability to navigate market cycles and make well-informed decisions.
Exploring Triple Tops and Bottoms for Extended Reversal Patterns
Triple tops and bottoms are extended reversal patterns that indicate persistent exhaustion in buying or selling. A triple top consists of three peaks at similar price levels, signifying a strong resistance area. In contrast, a triple bottom features three troughs, indicating a robust support level. These patterns are often deemed more reliable than double tops or bottoms due to the increased number of tests at critical levels.
Traders seek volume confirmation when these patterns break, as higher volume during the breakout enhances the likelihood of a successful trend change. Understanding the mechanics of triple tops and bottoms provides traders with valuable insights into potential market reversals.
Research-Driven Advantages of Using a Chart Patterns Cheat Sheet
Integrating Risk Management with Chart Patterns
Incorporating pattern recognition into risk management strategies is vital for protecting capital. Traders can enhance their strategies by combining chart patterns with stop-loss placement to minimize potential losses while maximizing reward-to-risk ratios. By setting stop-loss orders just below key support levels or above resistance levels, traders can safeguard their investments.
This disciplined approach reduces emotional decision-making. By adhering to predefined risk management guidelines, traders can improve their overall performance and maintain a consistent trading strategy, even amidst market volatility.
Establishing Actionable Entry Steps for Trades
To enhance trading performance, it’s essential to create actionable steps for entering trades based on chart patterns. Timing is crucial; traders should look for entry points at pattern breakouts or during pullbacks. For example, entering a trade when the price breaks above a resistance level offers a clear signal of potential upward momentum.
Real-world examples demonstrate the effectiveness of this approach. Traders who wait for confirmation through volume and price movement typically achieve better results. By developing a systematic approach to entries, traders can enhance their overall strategy performance metrics.
Validating Pattern Effectiveness Through Backtesting
Backtesting serves as a valuable method for validating trading strategies grounded in chart patterns. By reviewing historical data, traders can evaluate the effectiveness of their pattern recognition criteria and refine their approaches. This process provides deeper insights into how specific patterns perform across various market conditions.
Identifying strengths and weaknesses in their strategies leads to improved consistency in decision-making processes. Backtesting offers empirical evidence that supports trading decisions, enhancing a trader’s confidence and adaptability to changing market dynamics.
Enhancing Trading Psychology with Structured Approaches
Utilizing a chart patterns cheat sheet can significantly bolster trading psychology. By offering predefined rules and guidelines, traders can minimize emotional stress and avoid cognitive biases during volatile market conditions. A clear reference point fosters discipline, helping traders adhere to their strategies without yielding to fear or greed.
Research indicates that a structured trading approach can lead to better emotional regulation, ultimately boosting performance. Relying on a cheat sheet allows traders to focus on executing their strategies rather than second-guessing their decisions under pressure.
Boosting Profitability Metrics through Pattern Recognition
Empirical studies show that traders who utilize pattern cheat sheets achieve superior risk-reward ratios and higher win rates. These visual aids streamline analysis, enabling traders to make data-driven decisions across different asset classes. By simplifying the identification of patterns, traders can concentrate on execution and strategy refinement.
The enhanced profitability metrics associated with cheat sheets underscore their effectiveness in improving trading performance. As traders become more adept at recognizing patterns, they can adjust their strategies to various market conditions, maximizing their success potential.
How Does Recognizing Patterns Enhance Trading Decisions?
Understanding the Importance of Volume Confirmation
Volume confirmation is a crucial component of pattern recognition that reinforces the validity of trading signals. Higher volume during breakouts reflects strong interest and commitment from market participants, indicating that the price movement is more likely to continue in the expected direction. Conversely, low volume may suggest a lack of conviction, leading to potential false moves.
Grasping the relationship between volume and price action helps traders filter out unreliable signals. By focusing on trades exhibiting strong volume confirmation, traders can improve their decision-making processes and increase the overall success rate of their strategies.
Strategies for Effective Timeframe Selection
Choosing the right timeframe for analyzing chart patterns is essential for aligning trades with broader market trends. Multiple timeframe analysis enables traders to observe patterns across different periods, providing a comprehensive understanding of market dynamics. For example, identifying a pattern on a daily chart while confirming it on an hourly chart can boost the probability of successful trades.
Aligning patterns with larger trends enhances traders’ chances of capturing significant price movements. This strategy also helps filter out noise from lower timeframes, facilitating more accurate decision-making in diverse market environments.
Key Advantages of Pattern Trading
- Visual clarity simplifies quick identification of patterns.
- Facilitates integration with additional technical indicators.
- Enhances the development of trading advantages through structured analysis.
- Improves consistency in decision-making processes.
- Supports effective risk management strategies.
- Encourages disciplined trading behavior.
- Boosts overall profitability metrics.
- Increases confidence in executing trades.
Frequently Asked Questions
What are chart patterns?
Chart patterns are formations created by the price movements of an asset on a chart. They assist traders in predicting potential future price movements, indicating trends or reversals.
Why are support and resistance levels significant?
Support and resistance levels act as psychological barriers in trading, aiding traders in forecasting potential price reversals and continuations. Recognizing these levels enhances decision-making processes.
How do I identify a head and shoulders pattern?
A head and shoulders pattern consists of three peaks: a higher peak (head) flanked by two lower peaks (shoulders). It indicates a potential trend reversal when the neckline is breached.
What role does volume play in trading patterns?
Volume confirms the strength of a price movement. High volume during breakouts signifies strong interest, while low volume may suggest a false signal, making volume analysis essential.
How can I enhance my trading psychology?
Using a chart patterns cheat sheet can improve trading psychology by providing established rules, reducing emotional stress, and mitigating cognitive biases during trading.
What are flags and pennants?
Flags and pennants are short-term continuation patterns that indicate price consolidation before the trend resumes. They offer quick trading opportunities for traders.
What is backtesting in trading?
Backtesting involves analyzing historical data to validate trading strategies based on chart patterns. It helps traders refine their approaches and enhance consistency in decision-making.
What is the most effective way to set stop-loss orders?
Stop-loss orders should be placed just below support levels for long positions or above resistance levels for short positions. This strategy helps protect capital while allowing for potential price fluctuations.
What are double tops and bottoms?
Double tops and bottoms are reversal patterns signaling potential trend changes. A double top indicates the exhaustion of buying pressure, while a double bottom suggests a buildup of buying interest.
How does timeframe selection impact trading decisions?
Choosing the right timeframe for analyzing patterns helps align trades with broader market trends. Multiple timeframe analysis increases the probability of successful trades by providing a comprehensive market view.