

Understanding the Least Squares Moving Average (LSMA) Methodology
Core Principles of LSMA Explained

The least squares moving average (LSMA) is an advanced statistical technique aimed at reducing errors in trend estimation. By aligning data points with a linear model over designated time frames, it offers traders and analysts a smoother visualization of underlying movements across various datasets. This method effectively minimizes the influence of noise, leading to more informed decision-making.
The LSMA adjusts in real-time to recent data, ensuring that the projected averages stay accurate during sequential analyses. This responsiveness is vital in dynamic settings like financial markets, where information can change swiftly. By concentrating on error minimization instead of simple averaging, the LSMA presents a sophisticated approach to trend comprehension.
Ultimately, the LSMA improves data trend interpretation, making it an essential tool across diverse sectors, from finance to engineering. Its foundational principles focus on precision, adaptability, and noise reduction, establishing a robust basis for effective analysis.
Steps for Calculating Initial LSMA Values
To effectively utilize the LSMA, users need to begin by selecting an appropriate period length that aligns with their analytical objectives. This period plays a crucial role as it dictates the number of data points included in the regression analysis. Once the period is set, regression techniques can be employed to calculate the slope and intercept of the linear model.
The calculations required to derive these values are relatively straightforward, making the LSMA accessible for both beginners and seasoned analysts. By prioritizing recent data, the LSMA guarantees that the averages respond to current trends, yielding a more accurate depiction of market movements. This dynamic aspect allows for immediate updates that can greatly improve decision-making processes.
As users gain experience with the LSMA, they can enhance their approach by modifying the period length based on the specific attributes of the data being analyzed. This adaptability is one of the significant strengths of the LSMA, enabling it to remain applicable across multiple industries and contexts.
What Distinguishes LSMA from Other Methods?
The distinctiveness of the least squares moving average stems from its mathematical framework, which emphasizes error minimization over conventional averaging techniques. This focus equips the LSMA with superior responsiveness under variable conditions, making it especially beneficial for traders and analysts who demand precise forecasting abilities.
The key advantages of utilizing LSMA for trend analysis include:
- Enhanced precision in trend identification
- Decreased lag in comparison to simple moving averages
- Increased adaptability to market fluctuations
- Clearer understanding of data patterns
These benefits position the LSMA as a preferred tool for professionals across various domains, including finance, economics, and data science. Its capability to deliver a nuanced perspective on data trends empowers analysts to make educated decisions that can lead to improved results.
The LSMA’s mathematical rigor, coupled with its practical utility, differentiates it from other methodologies. It simplifies the analytical process while equipping users with the necessary tools to effectively navigate complex datasets.
Historical Evolution of LSMA

The concept of least squares moving averages traces back to statistical regression techniques developed in the nineteenth century. Initially created for analyzing data trends, these techniques have undergone significant transformations over the years. The shift from theoretical notions to practical applications in trading and analysis illustrates the method’s flexibility and relevance.
As financial markets grew more intricate and data-centric, the LSMA emerged as a contemporary trading instrument that merges mathematical accuracy with real-world market applications. It has been adopted by traders and analysts striving to enhance their analytical results, particularly in fast-paced environments where reliable predictions are essential.
The development of the LSMA mirrors broader trends in data analysis and statistical methodologies. Today, it serves as a testament to the effectiveness of blending historical insights with current demands, empowering users to harness its capabilities for improved decision-making across various sectors.
Insights from Experts on Least Squares Moving Average (LSMA)
How to Choose the Best Periods for LSMA
Selecting the ideal period for the LSMA is crucial for optimizing its performance. Adjusting the period length can enhance efficacy by striking a balance between responsiveness and stability. For example, a shorter period may yield quick signals but can also increase noise, while a longer period smooths out fluctuations but may lag behind ongoing trends.
Real-world scenarios illustrate this balance. In fast-moving markets like cryptocurrency trading, analysts frequently opt for shorter periods to capture swift changes. Conversely, in more stable settings, such as blue-chip stock analysis, longer periods may produce more dependable insights. This adaptability enables practitioners to customize the LSMA to their unique analytical contexts.
Ultimately, understanding the data characteristics being examined is key. By experimenting with various period lengths, users can identify the configurations that yield the most reliable outcomes, ensuring that their analysis remains relevant and actionable in an ever-evolving landscape.
How to Interpret LSMA Output Signals
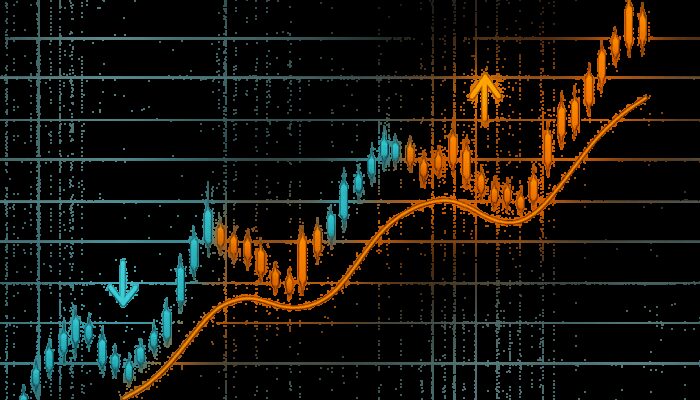
Interpreting the output signals generated by the LSMA requires careful attention to crossover points and changes in slope. These indicators often signal potential shifts in market trends, allowing analysts to react proactively. For instance, when the price rises above the LSMA line, it may indicate a buying opportunity, while a crossover below could suggest a selling point.
To interpret these signals effectively, analysts should adopt a systematic methodology. This includes validating the LSMA’s behavior across different market environments to ensure that signals are not viewed in isolation. By analyzing historical data and comparing it with current outputs, users can gain insights into the reliability of the generated signals.
Incorporating additional validation methods, such as volume analysis or other technical indicators, can further refine the accuracy of interpretations. By merging these techniques, traders can make informed decisions grounded in a comprehensive understanding of market dynamics.
Enhancing LSMA Analysis with Additional Tools
Integrating the LSMA with complementary indicators can significantly improve overall reliability and validate signals. This strategy helps prevent over-reliance on a single method, which could lead to incomplete assessments in complex data scenarios. For example, combining the LSMA with momentum indicators can yield deeper insights into market strength.
Expert analysis suggests that incorporating tools such as the Relative Strength Index (RSI) or Moving Average Convergence Divergence (MACD) alongside the LSMA can enhance decision-making. These indicators can validate LSMA signals, offering a more comprehensive perspective on market conditions. This multi-faceted approach equips traders with the tools to navigate uncertainties with increased confidence.
Regularly assessing the performance of these combined tools is vital. By evaluating how well the LSMA interacts with other indicators, users can refine their strategies and enhance overall analytical outcomes. This adaptability is essential for maintaining a competitive edge in dynamic environments.
How Does the Least Squares Moving Average (LSMA) Function?
Utilizing Regression Formulas in LSMA
The LSMA functions by calculating best-fit lines through recent data points utilizing least squares optimization techniques. This method produces forward projections that more accurately reflect true directional trends compared to traditional averages. By focusing on minimizing squared errors, the LSMA captures the essence of the underlying data trend.
When applying regression formulas, the LSMA computes the slope and intercept based on a defined lookback period. This enables the model to respond to recent price movements, ensuring that the averages remain applicable to current market conditions. The outcome is a smoother line that aids in spotting trends without the noise typically associated with simpler methods.
This approach proves especially advantageous in volatile data environments. By emphasizing recent observations, the LSMA can deliver clearer signals for traders, allowing them to make timely decisions based on dependable trend analysis. The accuracy of these projections sets the LSMA apart in the realm of data analysis.
Managing Data Variations with LSMA
Effectively managing data variations is a pivotal aspect of the LSMA’s functionality. Adjustments made during calculations account for outliers by highlighting recent values, which helps maintain relevance and mitigates distortion effects from anomalies. This capability is particularly crucial in markets marked by sudden price swings or irregular trends.
By concentrating on recent data points, the LSMA efficiently filters out noise and presents a clearer representation of prevailing trends. This focus ensures that the average line remains responsive to actual market movements, rather than being skewed by historical anomalies. traders can depend on the LSMA to guide their decisions even amidst turbulence.
Regularly reviewing the LSMA’s performance in various market contexts allows analysts to gauge its effectiveness in managing variations. By comparing the LSMA’s outputs with actual market behavior, users can make informed adjustments to their strategies, improving the overall accuracy and reliability of their analyses.
Importance of Regularly Validating LSMA Results
Continuous validation of the LSMA’s results is crucial for ensuring sustained accuracy in applications where precision is paramount. Regular assessments involve comparing the generated lines against actual observations to confirm alignment. This practice helps identify discrepancies and facilitates necessary adjustments.
Analysts should establish a routine for validating results, especially in fast-paced environments where conditions can shift rapidly. By consistently reviewing the LSMA’s performance, users can ensure that their analyses remain relevant and precise. This practice not only enhances decision-making but also builds confidence in the LSMA’s reliability as a forecasting tool.
Incorporating feedback mechanisms into the validation process can further enhance outcomes. By systematically evaluating the LSMA’s effectiveness in predicting market movements, traders can refine their strategies and improve the overall quality of their analyses. This commitment to ongoing validation distinguishes successful practitioners in the field.
Calculating Linear Coefficients for LSMA
The LSMA approach computes the slope and intercept by minimizing squared errors across a range of price data points. This mathematical framework allows the line to align closely with historical trends before extending it forward for predictive smoothing in trading analysis. The calculated coefficients play a crucial role in shaping the LSMA’s output.
By prioritizing error minimization, the LSMA ensures that the average line not only reflects past performance but also predicts future movements accurately. This ability is particularly beneficial in trading scenarios, where precise forecasts can lead to substantial financial gains. The accuracy of the linear coefficients enhances the overall effectiveness of the LSMA.
Users can deepen their understanding of the LSMA by exploring how different periods affect the derived coefficients. By experimenting with various lookback periods, analysts can uncover insights into the dynamics of their specific markets, ultimately leading to more informed trading decisions and improved analytical outcomes.
Incorporating Period Adjustments into LSMA
Integrating period adjustments into the LSMA is essential for optimizing its effectiveness across varying market conditions. Users can select suitable lookback periods based on market volatility levels, which directly influences the sensitivity of the resulting average line. This adaptability is vital for generating optimal signals without unnecessary lag.
For instance, in highly volatile markets, shorter lookback periods may be used to capture rapid price shifts. In contrast, in more stable environments, longer periods can produce a smoother average that mitigates noise. This flexibility enables traders to customize the LSMA to their specific needs, enhancing its applicability across a range of asset classes and timeframes.
Ultimately, the selection of period should correspond with the trader’s goals and the characteristics of the market being analyzed. By thoughtfully choosing and adjusting periods, users can optimize the LSMA for their unique analytical scenarios, ensuring responsiveness to current market dynamics.
Evidence-Based Advantages of Least Squares Moving Average (LSMA)
Improving Trend Detection with LSMA
Research demonstrates that the LSMA significantly enhances the identification of sustained movements through reduced lag and improved error management. This capability aids traders in making timely entry and exit decisions, optimizing their analytical workflows and strategies. By providing a clearer perspective on trends, the LSMA empowers users to act decisively in fast-paced environments.
In practical scenarios, the LSMA has shown superior performance compared to traditional moving averages in pinpointing trend reversals. This edge is particularly valuable in volatile markets, where swift shifts can lead to missed opportunities. By minimizing lag, the LSMA enables traders to capitalize on emerging trends more effectively.
The LSMA’s capacity to adapt to recent data ensures that users stay informed about current market conditions. This responsiveness is crucial for maintaining an advantage in competitive trading landscapes, where timely decisions can greatly impact results.
Mitigating False Signals with LSMA
Evidence indicates that the LSMA decreases the frequency of misleading signals compared to basic averages. The fitting process inherent in the LSMA smooths out irregularities, yielding clearer insights into market behavior. This clarity supports more confident actions in various conditions, helping traders avoid costly errors.
Traders often face situations where traditional moving averages generate false signals due to noise and fluctuations. The LSMA addresses this challenge by concentrating on error minimization, resulting in a more reliable indicator of market trends. This reliability is essential for maintaining trust in the analysis process.
By adopting the LSMA, traders can enhance their decision-making processes, relying on a tool that offers more accurate representations of market dynamics. This improvement in signal quality ultimately leads to better trading outcomes and a more robust analytical framework.
Supporting Long-Term Analysis with LSMA
The LSMA is advantageous for long-term analysis, revealing persistent patterns that inform strategic planning. Real-world examples illustrate how analysts have effectively utilized the LSMA over extended periods to identify significant trends and make informed decisions grounded in solid data interpretations.
For instance, in stock market analysis, the LSMA can highlight long-term bullish or bearish trends, enabling investors to adjust their portfolios accordingly. By offering a clearer view of historical performance, the LSMA allows users to base their strategies on reliable data rather than fleeting fluctuations.
This long-term perspective is especially valuable for institutional investors and portfolio managers who require insights into sustained trends. By leveraging the LSMA’s strengths in error minimization, these professionals can devise strategies that align with their investment goals, ultimately enhancing performance over time.
Common Applications of Least Squares Moving Average (LSMA)
Tracking Evolving Price Trends
Analysts often employ the LSMA to monitor developing trends in financial charts. By generating adaptive lines that highlight momentum shifts, the LSMA aids in identifying optimal entry points during continuous observation periods. This capability is essential for traders aiming to capitalize on price movements.
For example, in forex trading, the LSMA can assist in spotting trends in currency pairs, allowing traders to time their entries and exits more precisely. By observing the interaction between price and the LSMA line, analysts can glean insights into potential reversals or continuations, enhancing their trading strategies.
The LSMA’s adaptability ensures its relevance in dynamic markets. By continuously updating projections based on recent data, the LSMA provides a dependable framework for tracking price trends, enabling users to make well-informed decisions in real-time.
Forecasting Future Market Movements
Projections derived from the LSMA help analysts anticipate forthcoming changes based on current trajectories. By utilizing the fitted model, users can prepare structured responses ahead of potential developments in data series. This predictive capability is invaluable in fast-paced environments where timely decisions are crucial.
For instance, in commodity trading, the LSMA can aid in predicting price movements based on historical patterns, allowing traders to proactively adjust their strategies. By analyzing LSMA outputs alongside other market indicators, users can develop a comprehensive understanding of potential future movements.
The LSMA’s emphasis on minimizing errors enhances the accuracy of these forecasts, equipping traders with greater confidence in their analyses. users can navigate complex market conditions with a structured approach, ensuring they remain prepared for changing dynamics.
Optimizing Portfolio Management Decisions
The LSMA seamlessly integrates into portfolio allocation processes by offering objective trend data that informs adjustments. This feature allows traders to maintain balance across holdings through consistent assessments of directional information. By leveraging the LSMA, investors can optimize their portfolio decisions based on reliable insights.
For example, an asset manager might utilize the LSMA to evaluate the performance of various holdings, identifying which assets are trending positively and which may need adjustments. This data-driven approach enhances the decision-making process, ensuring that portfolios align with market conditions.
The LSMA’s adaptability enables real-time updates, allowing investors to respond swiftly to changes in market dynamics. This responsiveness is crucial for maintaining a competitive edge in the ever-evolving landscape of investment management.
Applications in Risk Assessment
Traders utilize the LSMA to assess potential risks by analyzing deviation patterns from the average line. This analysis assists in establishing appropriate stop-loss levels and effectively managing exposure during volatile market conditions. By focusing on the LSMA’s outputs, traders can identify potential risks associated with their positions.
For example, during periods of heightened volatility, the LSMA can signal when prices deviate significantly from the average, indicating possible risk factors. This information empowers traders to make informed decisions regarding their risk management strategies, ensuring protection against unfavorable market movements.
The LSMA’s ability to deliver clear signals enhances traders’ confidence in their risk assessments. By relying on a tool that minimizes errors and highlights trends, users can navigate complex market environments with greater assurance, ultimately fostering more effective risk management practices.
Generating Effective Trading Signals with LSMA
The LSMA produces actionable signals when prices engage with the average line, enabling users to detect overextensions or confirmations. These interactions guide timely buy and sell decisions within various trading strategies, making the LSMA a valuable asset for traders seeking to enhance their performance.
For instance, when the price crosses above the LSMA, it may indicate a bullish signal, encouraging traders to consider entering the market. In contrast, a crossover below the LSMA could suggest bearish sentiment, prompting users to exit positions or implement protective measures.
By incorporating the LSMA into their trading strategies, users can improve their capacity to identify key market movements. This capability not only enhances decision-making but also aids in developing more robust trading plans tailored to specific market conditions.
Advanced Strategies for Utilizing Least Squares Moving Average (LSMA)
What Steps Enhance LSMA Accuracy?
Incorporating multi-period comparisons improves LSMA accuracy by cross-verifying signals across different timeframes. This technique minimizes discrepancies and elevates the quality of insights derived from core calculations. By analyzing LSMA behavior across various periods, users can refine their strategies and enhance overall decision-making.
For example, a trader might compare LSMA outputs from short-term and long-term periods to identify potential divergences. This analysis can reveal shifts in market sentiment, allowing users to adjust their strategies accordingly. By leveraging multi-period comparisons, analysts can gain a deeper understanding of market dynamics.
This technique allows for a more comprehensive view of trends, providing context for LSMA signals. By considering multiple timeframes, traders can make more informed decisions that align with their overall trading objectives, ultimately leading to improved outcomes.
Customizing LSMA with Unique Parameters
Users can tailor inputs like weighting factors to meet specific requirements, resulting in personalized LSMA versions that align closely with unique needs. This customization enhances the LSMA’s applicability in specialized analytical contexts, allowing traders to adjust the tool to their distinct strategies.
For instance, a trader focusing on a specific asset class could modify the weighting factors to emphasize certain periods more heavily. This tailored approach ensures that the LSMA captures the nuances of the market being analyzed, enhancing its effectiveness as a forecasting tool.
The key advantages of integrating customized parameters include:
- Increased alignment with specific trading methodologies
- Enhanced adaptability to varying market conditions
- Improved accuracy in trend identification
- Greater confidence in decision-making processes
By leveraging these customized inputs, traders can optimize the LSMA for their unique analytical scenarios, ensuring responsiveness to current market dynamics.
Exploring Hybrid Models for Enhanced Analysis
Combining the LSMA with other statistical approaches creates comprehensive frameworks that utilize strengths from multiple methodologies. This hybrid model strategy results in deeper insights and more resilient strategies for addressing complex data challenges. By integrating various techniques, analysts can enhance their analytical capabilities and improve decision-making processes.
For instance, a hybrid model might merge the LSMA with machine learning algorithms to identify intricate patterns in large datasets. This combination facilitates more robust predictions and insights, ultimately leading to improved trading outcomes. By exploring hybrid models, traders can remain ahead in an increasingly data-driven environment.
Hybrid approaches enable analysts to tackle specific challenges within their data analysis processes. By leveraging the strengths of diverse methods, users can create tailored solutions that enhance their overall analytical frameworks, ensuring effectiveness across various market conditions.
Maximizing Computational Efficiency in LSMA
Implementing optimized computational algorithms and parallel processing techniques significantly reduces the time needed for calculations on extensive datasets. This efficiency supports real-time applications and enhances overall performance in demanding analytical scenarios without sacrificing accuracy. By streamlining the computational process, users can devote more attention to analysis and decision-making.
For example, in high-frequency trading environments, where milliseconds can significantly impact outcomes, optimizing the LSMA’s computational efficiency is essential. By employing advanced algorithms, traders can swiftly generate LSMA outputs, allowing them to seize fleeting market opportunities.
Optimizing computational efficiency benefits LSMA applications beyond trading. Researchers and analysts in fields such as economics and engineering can utilize faster calculations, enabling them to analyze larger datasets and derive insights more effectively. This adaptability broadens the LSMA’s relevance across multiple domains.
Frequently Asked Questions about LSMA
What is the Least Squares Moving Average (LSMA)?
The LSMA is a statistical approach that minimizes errors in trend estimation by aligning data points with a linear model over defined periods, offering smoother representations of underlying movements in datasets.
How is the LSMA calculated?
To calculate the LSMA, select a period length, apply regression techniques to derive slope and intercept values, and generate projected averages that dynamically adapt to recent observations.
What benefits does LSMA provide?
Notable advantages include enhanced trend detection, reduced lag compared to simple averages, improved adaptability to market changes, and clearer insights into data patterns.
Is LSMA applicable across different markets?
Yes, the LSMA can be utilized in various markets, including stocks, forex, and commodities, making it a versatile tool for trend analysis and forecasting.
How does LSMA differ from traditional moving averages?
Unlike traditional moving averages, the LSMA emphasizes error minimization, resulting in more accurate trend representation and diminished noise influence, which leads to clearer decision-making.
Why is selecting the right period important for LSMA?
Choosing the appropriate period is essential as it strikes a balance between responsiveness and stability, influencing the accuracy and reliability of the LSMA’s signals in diverse market conditions.
How can LSMA be combined with other indicators?
The LSMA can be effectively paired with indicators like RSI or MACD to validate signals and enhance overall reliability, offering a comprehensive view of market conditions.
What role does LSMA play in risk assessment?
The LSMA assists traders in evaluating potential risks by examining deviation patterns from the average line, aiding in establishing stop-loss levels and managing exposure during volatile market conditions.
How does LSMA support long-term analysis?
The LSMA uncovers enduring patterns that inform strategic planning, enabling analysts to identify significant trends and make informed decisions based on solid data interpretations.
What are hybrid models in the context of LSMA?
Hybrid models merge LSMA with other statistical methods to leverage strengths from multiple approaches, yielding deeper insights and more resilient strategies for managing complex data challenges.