

Understanding Support and Resistance Levels in Trading
Key Concepts of Support and Resistance
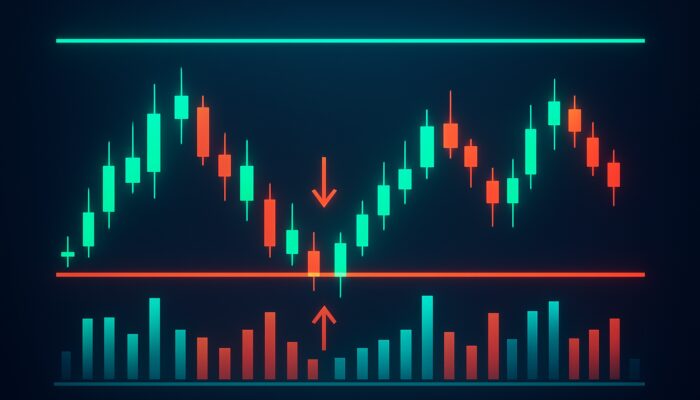
Traders utilize support and resistance levels to pinpoint potential price reversals and continuations in varying market conditions. By analyzing historical price movements and volume fluctuations, traders can effectively predict where price might encounter obstacles in its movement. This analysis spans across multiple timeframes, offering a holistic view of market behavior.
Support levels are identified as price points where buying interest surpasses selling pressure, while resistance levels signify areas where selling pressure has outstripped buying interest historically. This interaction creates a framework that traders leverage to forecast possible market movements. By studying past price actions, traders can recognize these pivotal levels that inform future trading strategies.
The power of these levels lies in their psychological impact. Market participants often recall previous price behaviors at these levels, resulting in predictable market reactions. This collective memory can lead to self-fulfilling prophecies where traders’ actions reinforce the importance of these levels, further shaping market dynamics.
Identifying Common Chart Patterns
Identifying prevalent chart patterns is vital for predicting market movements and sharpening decision-making during trading sessions. Patterns such as head and shoulders, double tops, and flags frequently occur near support and resistance levels. Each of these formations provides traders with insights into prospective price movements and prevailing market sentiment.
For instance, a head and shoulders pattern forming at a resistance level may suggest a reversal, warning traders to exit long positions or consider shorting the asset. Conversely, a double bottom pattern emerging at a support level might indicate a bullish reversal, encouraging traders to enter long positions. Regular practice and careful observation of these patterns can greatly improve a trader’s decision-making capabilities.
Recognizing these formations requires attention to detail and an understanding of market psychology. As traders become more familiar with these patterns, they can adopt a systematic trading approach, allowing them to respond adeptly to market fluctuations and seize potential opportunities.
How Does Market Psychology Influence Trading?
Market psychology significantly influences the dynamics of support and resistance levels. Participants often exhibit predictable behavior at these levels, driven by their collective memory of past price actions. For example, as prices near a support level, traders may instinctively buy, anticipating a price rebound, while at resistance levels, they may sell, expecting a reversal.
This behavior can create self-fulfilling prophecies, where traders’ actions affirm the importance of these levels. If a large number of traders believe a resistance level will hold, their selling actions may cause the price to fail to break through that barrier. Understanding this psychological dimension is crucial for traders navigating the nuances of market sentiment.
External factors such as news events and overall market sentiment can heighten these psychological responses. Positive economic news might lead traders to overlook previous resistance levels, pushing prices upward. Conversely, negative news can trigger panic selling at support levels. Recognizing these psychological influences enables traders to anticipate market movements and make better-informed decisions.
Insights from Experts on Support and Resistance Levels

Real-World Examples of Effective Trading
Experienced analysts frequently review historical data to illustrate how support and resistance levels have facilitated precise entry and exit points across various asset classes. During the 2008 financial crisis, for example, traders noted that the S&P 500 index consistently rebounded from the 1,000-point mark, which served as a crucial support level. Traders who identified this trend were able to profit from these rebounds.
In the forex market, the EUR/USD currency pair has shown consistent resistance at the 1.2000 level. Traders monitoring this level could make strategic decisions, either exiting long positions or initiating short trades as the price approached this threshold. These real-world instances underscore the practical application of support and resistance levels in diverse trading scenarios.
Commodities like gold frequently exhibit distinct support and resistance levels. For instance, when gold prices neared $1,800 per ounce, many traders recognized this as a significant resistance point, leading to a considerable sell-off. Understanding these levels enables traders to make strategic decisions grounded in historical price behavior, improving their overall trading performance.
Analyzing Trends for Confirmation
Professionals combine various indicators to validate the strength of support and resistance levels while minimizing false signals in volatile markets. For example, merging moving averages with support and resistance levels can yield a clearer perspective on market trends. When a price approaches a support level that aligns with a moving average, it bolsters the likelihood of a reversal.
Utilizing momentum indicators, such as the Relative Strength Index (RSI), is another effective strategy. If the RSI indicates an oversold condition while the price hovers near a support level, it may affirm the chance of a bounce. This multi-dimensional approach aids traders in avoiding reliance on a single indicator, enhancing their decision-making process.
Volume analysis is also vital for verifying the significance of support and resistance levels. A price level that holds with substantial volume is generally deemed more important than one that holds with minimal volume. By integrating these various indicators, traders can construct a comprehensive framework to assess market conditions and make informed trading choices.
Essential Steps for New Traders

Beginners aiming to master support and resistance levels should start by marking recent highs and lows. This fundamental step enables traders to visualize where significant price movements have occurred, aiding in the identification of future levels. By consistently tracking these levels, newcomers can gradually enhance their understanding of market behavior.
Next, engaging in simulated trading can help develop skills without financial risk. Many trading platforms provide demo accounts that allow users to test various strategies while monitoring their performance. This practical experience is invaluable for grasping how support and resistance levels function in real-time market scenarios.
Maintaining a trading journal to document observations and decisions related to support and resistance levels can be beneficial. Recording trades and reflecting on their outcomes offers insights into personal trading patterns and areas for growth. Over time, this practice can significantly improve a trader’s ability to effectively identify and utilize these critical levels.
How Do Support and Resistance Levels Guide Entry Points?
Strategically Timing Market Entries
Successfully utilizing support and resistance levels allows traders to align their positions with likely turning points, maximizing potential returns while managing downside risk. Identifying a significant support level enables traders to enter long positions near that level for a favorable risk-reward ratio. Similarly, selling near a resistance level can yield positive results.
Timing is essential; entering trades at these levels requires discipline and patience. Traders should seek confirmation signals, such as price action patterns or spikes in volume, before committing capital. This method reduces the risks associated with false breakouts and enhances the chances of successful trades.
Understanding the broader market context can refine timing decisions. Economic indicators, news events, and general market sentiment can influence price behavior at support and resistance levels. By incorporating these factors into their analysis, traders can make more informed choices about when to enter or exit positions.
Incorporating Risk Management
Integrating support and resistance levels with stop orders creates structured plans that safeguard capital during unexpected price fluctuations. For instance, placing a stop-loss order just below a support level when entering a long position can help mitigate losses if the price unexpectedly declines. This strategic approach ensures traders have a predefined exit point, reducing emotional decision-making during volatile market conditions.
Including take-profit levels at resistance points allows traders to secure profits when prices hit predetermined targets. This disciplined risk management practice helps maintain consistent performance and avoids the pitfalls of greed or fear that can lead to poor trading decisions.
Traders should regularly reassess their risk management strategies to adapt to shifting market conditions. As support and resistance levels change, so too should the corresponding stop-loss and take-profit orders. By proactively managing risk, traders can better navigate the market’s complexities while protecting their capital.
What Factors Affect Breakout Success?
Volume surges and news events often dictate whether a support or resistance level holds firm or gives way, creating opportunities for informed traders. A breakout occurs when the price decisively surpasses a support or resistance level, typically accompanied by increased trading volume. This volume surge can affirm the breakout’s strength, indicating that the price may continue in the new direction.
News events, such as economic reports or geopolitical developments, can greatly influence breakout success. For instance, if a positive earnings report spurs buying interest, the price may breach a resistance level with strong volume, suggesting a sustained upward trend. Conversely, negative news could incite sell-offs, resulting in prices breaking through support levels.
Traders should remain alert during these critical moments, as the potential for rapid price movement presents both opportunities and risks. By monitoring volume and being aware of upcoming news events, traders can position themselves strategically to take advantage of breakout situations while effectively managing risk.
Essential Tools and Indicators for Support and Resistance Levels
Utilizing Moving Averages Effectively
Moving averages are valuable tools for identifying dynamic areas where support or resistance may arise during ongoing trends. By smoothing out price data, moving averages help traders visualize trends and potential reversal points. For instance, a 50-day moving average can act as a support level during an uptrend, while the same moving average may serve as resistance in a downtrend.
Traders often employ multiple moving averages to strengthen their analysis. For example, a crossover of a short-term moving average above a long-term moving average can signal a potential bullish trend, while a crossover below may suggest bearish sentiment. This dynamic approach allows traders to adjust strategies in response to changing market conditions.
Combining moving averages with support and resistance levels can yield additional confirmation for trading decisions. When the price approaches a moving average that aligns with a support or resistance level, it solidifies the validity of that level. This synergy between moving averages and support/resistance analysis can lead to more informed trading strategies.
Applying Fibonacci Retracements
Fibonacci retracements are a widely used tool among traders for forecasting potential reversal zones with quantifiable accuracy in chart analysis. By drawing horizontal lines at key Fibonacci levels (23.6%, 38.2%, 50%, 61.8%, and 76.4%) based on significant price swings, traders can identify areas where price may retrace before continuing its trend.
These levels frequently align closely with traditional support and resistance levels, offering additional confirmation for potential price movements. For example, if a price retracement approaches the 61.8% Fibonacci level coinciding with a previous support level, traders might view this as a strong buying opportunity.
Incorporating Fibonacci retracements into trading strategies enhances the ability to identify high-probability setups. By combining this tool with other indicators, such as moving averages or momentum oscillators, traders can create a robust framework for analyzing market conditions and making informed decisions.
Key Benefits of Using Charting Software
Charting software plays an essential role in effectively identifying support and resistance levels. The following are key advantages of employing advanced charting tools:
- Improved visualization features for quick identification of levels across multiple assets.
- Customizable indicators and overlays tailored to individual trading styles.
- Real-time data updates that ensure accurate market analysis.
- Backtesting capabilities to assess strategies based on historical performance.
- Integration with news feeds and economic calendars for well-informed decision-making.
These features empower traders to make better-informed decisions, enhancing their overall trading performance and enabling efficient navigation through the complexities of the market.
Research-Driven Advantages of Support and Resistance Levels
Statistical Advantages in Trading Performance
Research indicates that consistently applying support and resistance levels improves win rates when complemented with disciplined position sizing and exit rules. Traders who effectively utilize these levels can identify high-probability setups, resulting in more successful trades. Studies show that traders who incorporate these strategies into their trading plans tend to experience better risk-adjusted returns.
Traders who maintain a disciplined trading approach, including strict adherence to support and resistance levels, often outperform those who do not. This statistical edge is particularly pronounced in volatile market conditions, where clear levels can guide decision-making and minimize emotional trading.
Incorporating support and resistance levels into trading strategies boosts overall performance. This disciplined methodology not only enhances win rates but also contributes to sustained profitability over time.
Developing Enhanced Decision Frameworks
Data-driven strategies minimize emotional trading by offering objective reference points derived from historical price behavior. Support and resistance levels act as crucial benchmarks for traders, enabling them to make informed decisions based on past price actions rather than impulsive reactions to market fluctuations.
By relying on these levels, traders can cultivate a structured decision-making framework that enhances their ability to navigate the complexities of the market. This approach mitigates the emotional impact, leading to more consistent trading outcomes and improved overall performance.
Integrating technical analysis tools alongside support and resistance levels can further refine decision-making processes. By combining multiple indicators, traders can gain a comprehensive understanding of market conditions and make more informed choices that align with their trading strategies.
Long-Term Benefits of Support and Resistance Levels
Longitudinal studies reveal sustained advantages for traders who adapt support and resistance levels to changing market structures. Traders who consistently monitor and adjust their strategies based on these levels maintain a competitive edge over time. This adaptability is crucial in dynamic market environments where conditions can shift rapidly.
Traders who incorporate support and resistance levels into their long-term trading strategies often experience improved performance metrics. By routinely assessing these levels, traders can identify emerging trends and modify their strategies accordingly, leading to more successful trades.
Taking a long-term perspective enables traders to capitalize on broader market movements while leveraging the benefits of support and resistance levels. This strategic approach fosters a deeper understanding of market dynamics and enhances overall trading performance.
Recognizing the Limitations of Support and Resistance Levels
Recognizing False Signals
False signals can arise when prices temporarily breach support or resistance levels, prompting premature actions that may result in losses. Whipsaws, or abrupt price reversals, can catch traders off guard, highlighting the necessity for additional filters to validate the significance of these levels. Depending solely on support and resistance without accounting for other indicators can lead to missed opportunities or unnecessary losses.
To mitigate the effects of false signals, traders should integrate confirmation tools such as volume analysis or momentum indicators. For instance, if a price breaks through a resistance level with low volume, it may indicate a lack of conviction among market participants, suggesting that the breakout could be false.
Recognizing the potential for false signals is essential for effective risk management. By employing strategies that incorporate multiple indicators, traders can enhance their decision-making and reduce the likelihood of being caught in whipsaws.
Addressing Subjectivity in Level Placement
Traders may draw support and resistance levels differently, leading to inconsistent results without standardized methodologies. This subjectivity can create confusion in trading decisions, especially in fast-moving markets. For instance, one trader might identify a support level at $50, while another may see it at $48, resulting in conflicting strategies.
To tackle this challenge, traders should develop a consistent method for identifying these levels. Utilizing a mix of technical analysis tools, such as moving averages or Fibonacci retracements, can help establish a more objective framework for determining support and resistance.
Sharing insights and collaborating with other traders can enhance the understanding of these levels. Engaging in discussions about different placements can offer valuable perspectives and improve overall trading strategies, reducing the impact of subjectivity.
Market Condition Dependencies
Strong trends may render traditional support and resistance levels ineffective, necessitating adaptive techniques for ongoing relevance. In trending markets, prices often move decisively, making it difficult for traders to rely solely on historical levels. For example, during a pronounced uptrend, previous resistance levels may convert into new support levels, altering the dynamics of price behavior.
To navigate these evolving conditions, traders should remain flexible in their approach. Adapting strategies to align with prevailing market trends can enhance the effectiveness of support and resistance analysis. This might involve adjusting stop-loss levels or re-evaluating entry points based on the current market context.
Traders should stay attuned to broader economic trends and news events that may influence market conditions. By understanding the underlying factors driving price movements, traders can make more informed decisions and adjust their strategies accordingly.
Timeframe Variability Challenges
Support and resistance levels can vary significantly across different timeframes, leading to potential conflicts in trading decisions. A level of significance on a daily chart might not hold the same relevance on an hourly chart. This discrepancy emphasizes the importance of multi-timeframe analysis to achieve consistent results and avoid misinterpretations in dynamic market environments.
Traders can enhance their analysis by examining multiple timeframes simultaneously. For instance, a trader may recognize a strong support level on the daily chart while also observing a potential resistance level on the hourly chart. This comprehensive perspective allows for improved decision-making and helps traders align their strategies with prevailing market conditions.
Being mindful of timeframe-specific trends can assist traders in avoiding conflicting signals. By understanding how support and resistance levels behave across various timeframes, traders can develop a more nuanced approach to their trading strategies, ultimately leading to enhanced performance over time.
The Importance of Volume Analysis
Many traders neglect volume data when identifying support and resistance levels, leading to unreliable levels that may fail during breakouts. Volume serves as a critical indicator of market strength; levels that hold with high volume are generally viewed as more significant than those that hold with low volume. Ignoring this aspect can result in miscalculations and potential losses.
To improve predictive accuracy, traders should incorporate volume indicators into their analysis. For example, if a price approaches a resistance level and experiences a surge in volume, it may indicate a stronger likelihood of a breakout. Conversely, low volume during a breakout attempt might suggest weakness and increase the chance of failure.
By integrating volume analysis into their trading strategies, traders can enhance the reliability of their support and resistance levels. This approach not only improves decision-making but also contributes to more successful trading outcomes in volatile conditions.
Strategies to Enhance Skills in Support and Resistance Levels
Simulation Practice for Skill Development
Regular backtesting fosters intuition for recognizing high-probability setups without real financial exposure initially. By simulating trades based on historical data, traders can sharpen their skills in identifying support and resistance levels. This practice enhances their understanding of how these levels behave under various market conditions, leading to the development of a systematic trading approach.
Many trading platforms offer demo accounts that allow users to practice without risking real money. Engaging in simulated trading helps traders build confidence and develop their decision-making processes. As they encounter different scenarios, they can learn from their mistakes and successes, ultimately improving their trading skills.
Tracking performance during simulation can yield valuable insights. By analyzing outcomes and identifying patterns, traders can enhance their ability to recognize and effectively utilize support and resistance levels. This iterative process promotes continuous improvement and skill development.
Benefits of Daily Trading Reviews
Consistent journaling helps track performance patterns and refines level accuracy over successive sessions. Daily reviews enable traders to reflect on their decisions, analyze outcomes, and pinpoint areas for improvement. The following are key benefits of maintaining a trading journal:
- Increased self-awareness regarding trading behaviors and emotional responses.
- Identification of recurring patterns in trading performance.
- Improved accuracy in recognizing support and resistance levels.
- Opportunity to assess the effectiveness of different strategies.
- Enhanced accountability in adhering to trading plans.
By regularly reviewing their trades, traders can gain a deeper understanding of their strengths and weaknesses. This process ultimately leads to improved decision-making and more consistent trading results.
Learning from Mentorship and Feedback
Interacting with experienced peers accelerates learning by sharing insights on nuanced interpretations of support and resistance levels. Mentorship offers valuable perspectives that can enrich a trader’s understanding of market dynamics. Seasoned traders often possess unique strategies and insights that can significantly benefit those who are newer to trading.
Participating in trading communities or forums can facilitate knowledge sharing and foster collaboration. Discussing specific trades and analyzing support and resistance levels together can provide new perspectives and refine strategies. This collaborative environment promotes continuous learning and growth.
Receiving constructive feedback on trading decisions can help uncover blind spots and enhance overall performance. Mentors can guide traders in identifying key levels and adapting strategies based on changing market conditions, ultimately improving a trader’s skills and confidence.
Multi-Timeframe Analysis for Enhanced Skills
Traders can strengthen their support and resistance skills by analyzing price action across multiple timeframes simultaneously. This method helps validate potential reversal points and increases the reliability of trading decisions over time. By examining longer timeframes, traders can identify broader trends, while shorter timeframes offer insights into precise entry and exit points.
For instance, a trader may discover a significant support level on the daily chart while observing a potential breakout on the hourly chart. This multi-timeframe analysis allows for a more comprehensive understanding of market dynamics and enhances decision-making processes.
Recognizing how support and resistance levels interact across various timeframes can also improve overall trading performance. By aligning strategies with prevailing trends and validating levels through multiple perspectives, traders can make more informed decisions and increase their chances of success.
Proven Strategies for Support and Resistance Levels
Implementing Multi-Timeframe Analysis
Aligning support and resistance levels across different charts reveals confluence zones that strengthen trading conviction and precision. Traders should start by identifying key levels on higher timeframes, such as daily or weekly charts, then look for corresponding levels on lower timeframes, like hourly or 15-minute charts.
Once these levels are established, traders can concentrate on potential entry points where multiple timeframes converge. For example, if a support level on the daily chart coincides with a support level on the hourly chart, it creates a stronger case for a potential bounce. This alignment enhances the reliability of trading decisions and heightens the likelihood of success.
Integrating other indicators, such as oscillators or moving averages, can further validate these confluence zones. By combining multiple tools and perspectives, traders can develop a more robust trading strategy that effectively capitalizes on support and resistance levels.
Real-World Applications of Combined Indicators
Combining oscillators with support and resistance levels illustrates practical enhancements in signal reliability. For instance, traders often use the Stochastic Oscillator alongside these levels to identify overbought or oversold conditions. When the price nears a support level and the Stochastic Oscillator indicates oversold conditions, it may signal a potential buying opportunity.
Similarly, the Moving Average Convergence Divergence (MACD) can be employed in conjunction with support and resistance analysis. If the MACD shows bullish divergence while the price approaches a support level, it reinforces the likelihood of a reversal. These combined indicators offer traders a more comprehensive understanding of market dynamics and enhance decision-making processes.
Real-world examples highlight the effectiveness of this approach. For instance, during a recent market rally, traders who combined support levels with oscillators experienced higher win rates, as they could pinpoint optimal entry points with greater confidence. This synergy between indicators fosters a more disciplined and informed trading strategy.
Optimizing Risk-Reward Ratios
Structuring trades around calculated distances to the next support or resistance levels ensures favorable risk-reward ratios that support overall portfolio growth. A common strategy involves placing stop-loss orders just below support levels for long positions or just above resistance levels for short positions. This method minimizes potential losses while maximizing upside potential.
For example, if a trader identifies a support level at $50 and anticipates a price target of $60, they can calculate the risk-reward ratio based on the distance to the stop-loss. If the stop-loss is set at $48, the risk amounts to $2, while the potential reward is $10. This favorable ratio enhances the overall profitability of the trading strategy.
Traders should regularly evaluate their risk-reward ratios to ensure alignment with their trading objectives. By maintaining a disciplined approach to risk management and optimizing trade structures, traders can enhance their long-term success and portfolio growth.
Advanced Techniques for Mastering Support and Resistance Levels
Real-Time Level Adjustments
Updating support and resistance levels in real-time accounts for changing price action and retains relevance throughout trading sessions. As market conditions evolve, traders must remain adaptable in their analysis and adjust their levels accordingly. This dynamic approach allows traders to respond to new information and emerging trends effectively.
For instance, if a price consistently breaks above a resistance level with increasing volume, it may signal a shift in market sentiment. Traders should revise their resistance levels to reflect this new reality, enabling more accurate decision-making.
Employing trailing stop orders helps manage risk while allowing for potential gains as prices move favorably. By continuously adjusting levels and strategies based on real-time data, traders can enhance their ability to navigate the complexities of the market successfully.
Integrating Volume Profile Analysis
Overlaying volume data at specific price levels reveals hidden areas of interest that complement traditional methods of identifying support and resistance. Volume profile analysis enables traders to visualize where substantial trading activity has occurred, offering insights into potential support and resistance zones that may not be apparent through price action alone.
For example, if a volume profile indicates significant trading volume at a particular price level, it may suggest strong interest among market participants. This information can guide trading decisions, as prices may struggle to move beyond these levels due to concentrated buying or selling activity.
Incorporating volume profile analysis into trading strategies enhances overall decision-making and increases the reliability of support and resistance levels. By understanding where significant trading activity occurs, traders can better anticipate price movements and adjust their strategies accordingly.
Benefits of Automation Tools in Trading
Automation tools play a crucial role in streamlining trading processes and enhancing the effectiveness of support and resistance analysis. The following are key advantages of utilizing automation tools in trading:
- Automated alerts for price movements near key levels, ensuring timely responses.
- Execution of trades based on predefined criteria, reducing emotional decision-making.
- Integration with multiple indicators for comprehensive analysis.
- Customizable settings tailored to individual trading strategies.
- Real-time data updates for accurate market assessments.
These features empower traders to make better-informed decisions, enhancing their overall trading performance and enabling them to navigate the complexities of the market effectively.
Frequently Asked Questions
What Are Support and Resistance Levels?
Support and resistance levels are price points on a chart where the price tends to reverse or consolidate. Support levels indicate where buying interest overcomes selling pressure, while resistance levels signify where selling interest exceeds buying pressure.
How Can I Identify Support and Resistance Levels?
Support and resistance levels can be determined by analyzing historical price action, marking recent highs and lows, and observing where price has reversed in the past. tools like moving averages and Fibonacci retracements can assist in locating these levels.
Why Are Support and Resistance Levels Important?
These levels are essential for traders as they provide insights into potential price reversals and continuations. They assist traders in making informed decisions about entry and exit points, thereby enhancing overall trading strategies.
Can Support and Resistance Levels Change Over Time?
Yes, support and resistance levels can evolve as market conditions change. Traders should regularly reassess these levels and adjust their strategies based on new information and price behaviors.
What Role Does Volume Play in Support and Resistance Analysis?
Volume is crucial for validating support and resistance levels. High volume at a level indicates strong interest, while low volume may suggest weakness. Incorporating volume analysis enhances the dependability of these levels.
How Can I Improve My Skills in Trading Support and Resistance Levels?
Improving skills involves regular practice through simulation, maintaining a trading journal for reflection, engaging with experienced traders for mentorship, and analyzing multiple timeframes to enhance understanding.
What Common Mistakes Should I Avoid with Support and Resistance Levels?
Common mistakes include relying solely on one timeframe for analysis, disregarding volume data, and failing to adjust levels as market conditions change. Diversifying analysis and remaining flexible is vital.
How Can I Use Support and Resistance Levels in Risk Management?
Support and resistance levels can be integrated into risk management by placing stop-loss orders just below support for long positions or above resistance for short positions. This helps minimize losses during unexpected price movements.
What Advanced Techniques Can I Use with Support and Resistance Levels?
Advanced techniques include real-time level adjustments based on current price action, integrating volume profile analysis for deeper insights, and utilizing automation tools to streamline trading processes.
Can I Trade Without Using Support and Resistance Levels?
While trading without these levels is possible, it may increase the risk of making uninformed decisions. Support and resistance levels provide valuable context for understanding market dynamics and enhancing trading strategies.