
Grasping the Fundamentals of On-Balance Volume Divergence
What Characterizes Volume Divergence Patterns?

Volume divergence takes place when the price movements of an asset diverge from changes in trading volume. This inconsistency often signals potential reversals in the asset’s momentum and direction. For traders, identifying these patterns is vital for making strategic decisions across various market conditions and timeframes.
When prices increase or decrease but are not supported by corresponding volume, it may indicate that the trend is weakening. Conversely, a rise in volume accompanying price movements typically suggests that the trend will continue. By understanding these dynamics, traders can better anticipate fluctuations in market behavior.
Essential Components of Indicator Development
Traders concentrate on cumulative volume changes along with price action to spot inconsistencies that may signify weakening trends or impending shifts. The on-balance volume (OBV) indicator is constructed by adding volume on days with price increases and subtracting it on days with price declines, resulting in a cumulative total that reflects buying and selling pressure.
Tracking these cumulative shifts is crucial for identifying divergences. When the price chart indicates new highs or lows that lack confirmation from volume trends, it signals to traders the possibility of market reversals. This analysis demands careful observation and a firm grasp of both price and volume dynamics.
Examining Historical Uses of Indicators
Analyzing historical chart examples illustrates how volume divergence has pinpointed key turning points across various asset classes. For example, during stock market corrections, divergence often acts as an early warning, enabling traders to adapt their strategies before significant price shifts occur.
In commodities trading, divergence can similarly reflect changes in market sentiment. By reviewing past instances where divergence preceded price reversals, traders can enhance their ability to predict future market movements and refine their trading strategies across different styles and timeframes.
Effectively Identifying Divergence Signals
How to Recognize Bullish and Bearish Divergence Signals
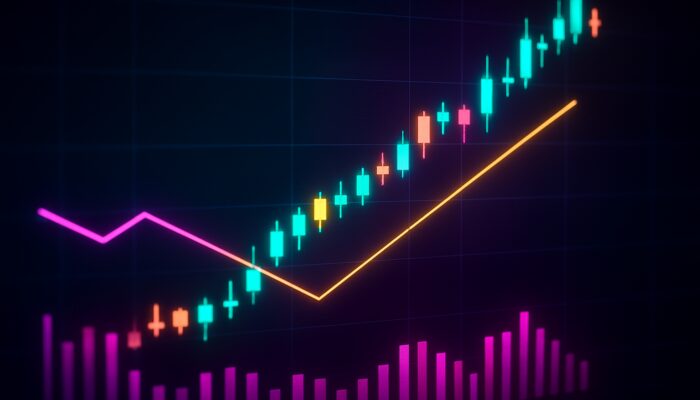
To accurately identify divergence signals, traders should monitor price highs and lows in relation to volume trends. A bullish divergence arises when prices reach lower lows while volume increases, suggesting that selling pressure may be diminishing and a reversal could be on the horizon.
On the other hand, a bearish divergence is recognized when prices achieve higher highs but volume decreases, indicating a potential weakening of buying momentum. Being able to identify these signals improves entry and exit timing, empowering traders to manage dynamic trading environments with increased confidence.
What Tools Can Enhance Signal Accuracy?
Combining volume indicators with additional technical measures significantly boosts the accuracy of divergence signals. Tools such as moving averages, relative strength index (RSI), and Bollinger Bands can provide additional layers of confirmation, minimizing the risk of false signals during analysis.
Utilizing these tools together allows traders to develop a more holistic view of market conditions. By cross-referencing volume divergence with other indicators, traders can enhance their decision-making processes and increase the reliability of their trading signals.
Key Chart Patterns to Monitor
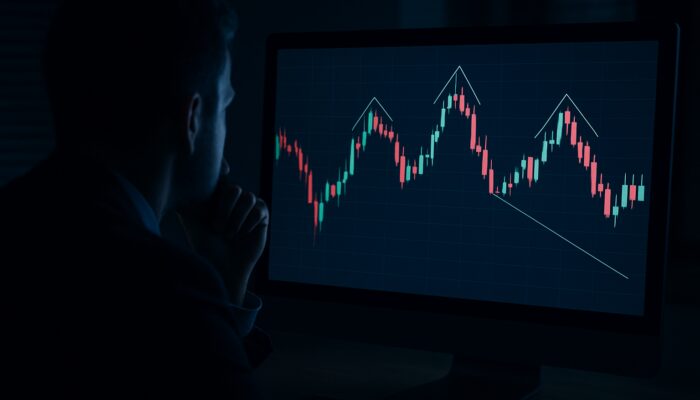
When pinpointing volume divergence, traders should keep a close eye on specific chart patterns, including:
- Double tops and bottoms
- Head and shoulders formations
- Flags and pennants
- Trendline breaks
- Support and resistance levels
Each of these patterns can indicate potential shifts in market momentum. Recognizing them in conjunction with volume divergence can inform precise trading actions, helping traders capitalize on emerging opportunities.
How Does On-Balance Volume Divergence Function in Real-World Trading?
Calculating Cumulative Volume Variations
Understanding on-balance volume divergence begins with calculating cumulative volume variations. This process entails adding daily volume to a running total when prices close higher and subtracting it when prices close lower. The resulting cumulative total illustrates the underlying strength or weakness of ongoing trends.
By maintaining this cumulative total, traders can visualize the interplay between price fluctuations and volume shifts. This insight is critical for recognizing potential divergences that may foreshadow upcoming trend reversals or continuations, thus enabling more informed trading decisions.
Interpreting Divergence Signals
When price and volume lines diverge, it indicates a loss of conviction among market participants. This scenario prompts traders to reassess their current positions and risk management strategies. For instance, if prices continue to rise while volume declines, it might suggest that the rally lacks solid support.
Grasping these divergences is vital for effective risk management. Traders should contemplate adjusting their stop-loss orders or taking profits when divergence signals emerge, as these can presage significant price corrections.
Real-World Examples Across Different Timeframes
Divergence appears differently across various timeframes, allowing traders to implement versatile strategies tailored to their individual preferences and objectives. In shorter timeframes like day trading, traders may encounter rapid divergences that necessitate swift decision-making and execution.
In contrast, longer-term charts may reveal more gradual divergences that indicate sustained trend reversals. By examining both short and long-term charts, traders can pinpoint entry and exit points that align with their trading strategies and risk tolerance.
Expert Perspectives on On-Balance Volume Divergence
Showcasing Real-World Trade Successes
Experts frequently illustrate how adept divergence detection can result in profitable outcomes. For example, a trader might identify a bullish divergence in a tech stock, where the price makes lower lows while the OBV rises. Recognizing this pattern prompts the trader to enter a position, capitalizing on the subsequent price increase.
Detailed discussions of entry points and exit strategies used in these trades provide invaluable insights. By sharing real-world examples, traders can learn how to effectively apply divergence analysis in their trading practices.
Analyzing Indicator Limitations
While on-balance volume divergence is a valuable tool, it’s essential to recognize its limitations. Divergence can occasionally produce misleading signals, particularly in volatile markets where price movements are erratic. Experts recommend that traders incorporate additional confirmations from other technical indicators to mitigate risks.
Understanding when divergence may yield false signals is crucial for maintaining discipline in trading. By recognizing the context and market conditions, traders can hone their strategies and avoid potential pitfalls associated with over-reliance on volume divergence.
Advanced Techniques for Interpretation
Experienced analysts share methodologies for refining divergence readings by employing multiple indicators to achieve greater precision across various market scenarios. Techniques such as utilizing trendlines, Fibonacci retracement levels, or candlestick patterns alongside volume analysis can offer deeper insights into market dynamics.
These advanced strategies enhance a trader’s capacity to interpret divergences accurately. By integrating various analytical tools, traders can construct a more robust framework for decision-making, leading to improved trading outcomes in different market conditions.
Assessing the Impact of Market Conditions on Divergence Signals
Market conditions, such as trending or ranging environments, significantly affect the reliability of on-balance volume divergence signals. In trending markets, divergences may provide clearer indications of potential reversals, while in ranging markets, they could prove less reliable due to frequent price fluctuations.
Traders should adjust their strategies according to prevailing market regimes. For instance, during a strong uptrend, bullish divergences may carry more weight, while bearish divergences in a downtrend might warrant closer scrutiny. Understanding these dynamics aids traders in effectively navigating diverse market conditions.
Emphasizing the Role of Volume Trends in Confirming Divergences
Industry experts highlight the importance of underlying volume patterns that accompany on-balance volume divergences. These volume trends provide essential context for more accurate market predictions and improved trade management strategies.
For example, a surge in volume during a bullish divergence strengthens the case for a potential price reversal. By evaluating volume trends alongside divergence signals, traders can refine their decision-making processes and enhance their overall trading performance.
What Are the Essential Components of Volume Divergence?
Methods for Integrating Volume Data
Accurate sourcing and processing of volume data are foundational for reliable divergence calculations. Traders should rely on reputable data providers to ensure that the volume figures they analyze are precise and timely. This reliability is vital for consistent analytical results.
Effectively integrating volume data into trading platforms facilitates seamless analysis and monitoring of divergence patterns. By utilizing advanced data integration methods, traders can boost their capacity to identify and act on significant volume divergence signals.
Analyzing Price Action Correlation
Aligning volume trends with price movements uncovers hidden dynamics that standard charts might miss. By examining the correlation between price action and volume changes, traders can gain deeper insights into market sentiment and potential reversals.
This correlation analysis can highlight discrepancies that may not be immediately apparent. Understanding the interaction between price and volume empowers traders to refine their strategies and make more informed decisions based on comprehensive market insights.
Establishing Risk Assessment Frameworks
Implementing on-balance volume divergence requires a solid risk assessment framework. Key benefits include:
- Enhanced position sizing
- Improved stop-loss placements
- Informed decision-making in volatile markets
- Effective capital protection strategies
By incorporating these components into their trading plans, traders can manage their capital effectively and reduce exposure to significant losses. A strong risk assessment framework is vital for long-term trading success.
Research-Driven Advantages of On-Balance Volume Divergence
Providing Actionable Steps for Implementation
Implementing on-balance volume divergence strategies demands structured approaches. Traders should begin by backtesting their divergence strategies using historical data to validate performance. This process enables them to refine their tactics before applying them in live market conditions.
Forward testing is equally important for evaluating the effectiveness of these strategies in real-time. By gradually incorporating divergence analysis into their trading routines, traders can build confidence and enhance their overall performance.
Improving Decision-Making Processes
Research shows that integrating volume divergence into broader trading plans can significantly refine decision-making processes. Data from studies indicates improved timing accuracy when traders account for divergence, leading to more consistent outcomes over time.
By weaving volume divergence into their analytical framework, traders can make well-informed choices that align with market conditions. This enhanced decision-making capability contributes to better long-term trading results.
Supporting Portfolio Management Objectives
Incorporating on-balance volume divergence into trading strategies helps balance risk across holdings. By identifying potential weak areas that require attention or adjustment, traders can proactively manage their portfolios.
This method allows for timely adjustments based on market conditions, ensuring that traders maintain a well-balanced and diversified portfolio. By monitoring divergence signals, traders can uncover opportunities for reallocation and risk management.
Why Is Monitoring Volume Changes Important for Traders?
Detecting Early Signs of Trend Weakness
Monitoring volume changes is essential for spotting early indications of trend weakness. Volume shifts often precede price reversals, offering advance notice that allows traders to proactively adjust their trading plans and exposure levels.
By remaining vigilant to these volume changes, traders can position themselves advantageously before significant market movements transpire. This proactive approach can lead to improved trading outcomes and minimized risk exposure.
Confirming Breakout Authenticity
Increased volume during breakouts, particularly when supported by divergence checks, helps differentiate genuine moves from fleeting fluctuations. This confirmation is crucial for reducing erroneous trades and ensuring traders capitalize on legitimate market opportunities.
Traders should closely observe volume patterns surrounding breakouts. By validating breakout authenticity through volume analysis, they can enhance their trading strategies and boost overall performance.
Cultivating Long-Term Analytical Skills
Regularly tracking volume changes fosters deeper market intuition through pattern recognition. As traders gain experience, their ability to identify volume divergence and its implications will develop, refining their analytical skills over time.
Ongoing education efforts, such as engaging with trading literature or participating in webinars, can further support this skill enhancement. By continuously improving their understanding of volume dynamics, traders can maintain a competitive edge in the market.
Successfully Implementing Trading Strategies
Establishing Alert Systems
Automated notifications based on divergence criteria simplify monitoring and enable traders to concentrate on high-probability setups without the need for constant manual chart reviews. By setting up alert systems, traders can respond swiftly to emerging opportunities.
These alerts can be configured to notify traders of significant divergence events, ensuring they never overlook critical trading signals. This efficiency enhances overall trading performance and promotes a disciplined approach.
Benefits of Strategy Integration
Integrating volume divergence strategies yields numerous advantages:
- Adaptability across various asset classes
- Enhanced risk-reward ratios
- Improved decision-making capabilities
- Greater precision in entry and exit points
These benefits contribute to a more robust trading strategy, enabling traders to navigate diverse market conditions while maximizing their potential returns.
Continuous Performance Assessment
Regular evaluations of strategy results facilitate refinements and ensure alignment with evolving market dynamics and personal trading objectives. By analyzing performance metrics, traders can identify areas for improvement and adjust their strategies accordingly.
This ongoing assessment process is crucial for long-term trading success. By remaining attuned to market changes and refining their approaches, traders can enhance their overall performance and achieve their trading goals.
Creating a Comprehensive Trading Plan
Developing a thorough trading plan that outlines specific entry and exit criteria, along with appropriate position sizing, ensures consistent application of strategies. This structured approach minimizes emotional decision-making during live market trades and volatile conditions.
A well-defined trading plan serves as a roadmap for traders, guiding their actions and helping maintain discipline. By adhering to their plan, traders can improve their chances of success and manage risk more effectively.
Integrating Risk Management Techniques
Incorporating solid risk management strategies into every trade is critical for safeguarding trading capital. Techniques such as stop-loss orders and position limits help maintain long-term profitability by preventing significant drawdowns from unforeseen adverse market movements.
Traders should prioritize risk management as a foundational aspect of their strategies. By integrating these techniques, they can protect their capital and enhance their overall trading performance.
Frequently Asked Questions
What is On-Balance Volume Divergence?
On-balance volume divergence is a trading concept where price movements do not align with volume changes, signaling potential reversals or continuations in market trends. Traders utilize it to make informed decisions based on volume analysis.
How Do I Calculate On-Balance Volume?
To calculate on-balance volume, add the day’s volume to the previous OBV if the price closes higher, and subtract it if the price closes lower. This process creates a cumulative total that reflects buying and selling pressure.
What Are the Advantages of Using Volume Divergence?
Employing volume divergence can enhance decision-making, improve timing accuracy, and support portfolio management by highlighting potential market reversals or continuations, enabling traders to adjust their strategies accordingly.
Can Volume Divergence Be Applied in Any Market?
Yes, volume divergence is applicable across various markets, including stocks, commodities, and forex. Its principles are universally relevant for analyzing price and volume relationships.
What Tools Can I Use Alongside Volume Divergence?
Traders often pair volume divergence with tools like moving averages, RSI, and trendlines to enhance signal accuracy and minimize the risk of false positives during analysis.
How Can I Identify Bullish and Bearish Divergences?
Bullish divergence occurs when prices form lower lows while volume increases, indicating potential upward reversals. Bearish divergence arises when prices hit higher highs but volume decreases, suggesting possible downward reversals.
What Common Chart Patterns Are Associated with Volume Divergence?
Typical chart patterns include double tops and bottoms, head and shoulders formations, flags, and trendline breaks. These patterns can signal potential shifts in market momentum when analyzed alongside volume divergence.
How Frequently Should I Monitor Volume Changes?
Traders should regularly monitor volume changes, especially during significant price movements or market events, to identify early signs of trend weakness and adjust their trading strategies accordingly.
What Are the Risks of Relying Solely on Volume Divergence?
Relying exclusively on volume divergence can result in misleading signals, particularly in volatile markets. It is crucial to incorporate additional confirmations from other indicators to mitigate risks and enhance decision-making.
How Can I Develop a Comprehensive Trading Plan?
To create a comprehensive trading plan, outline specific entry and exit rules, establish risk management techniques, and incorporate volume divergence analysis. This structured approach fosters discipline and improves trading outcomes.